Data Stewardship Dashboard
The Cloudera Navigator Data Stewardship dashboard captures a variety of information about data, metadata, and user jobs that process the data. The Data Stewardship dashboard provides information and metrics to help you understand the state of the data and data usage, and lets you visualize trends and averages for a variety of data sources and actions.
For example, system administrators use the Dashboard () to look at the Activity Summary page, which provides a comprehensive overall view—databases created, tables created, tables dropped, SQL queries started, and so on.
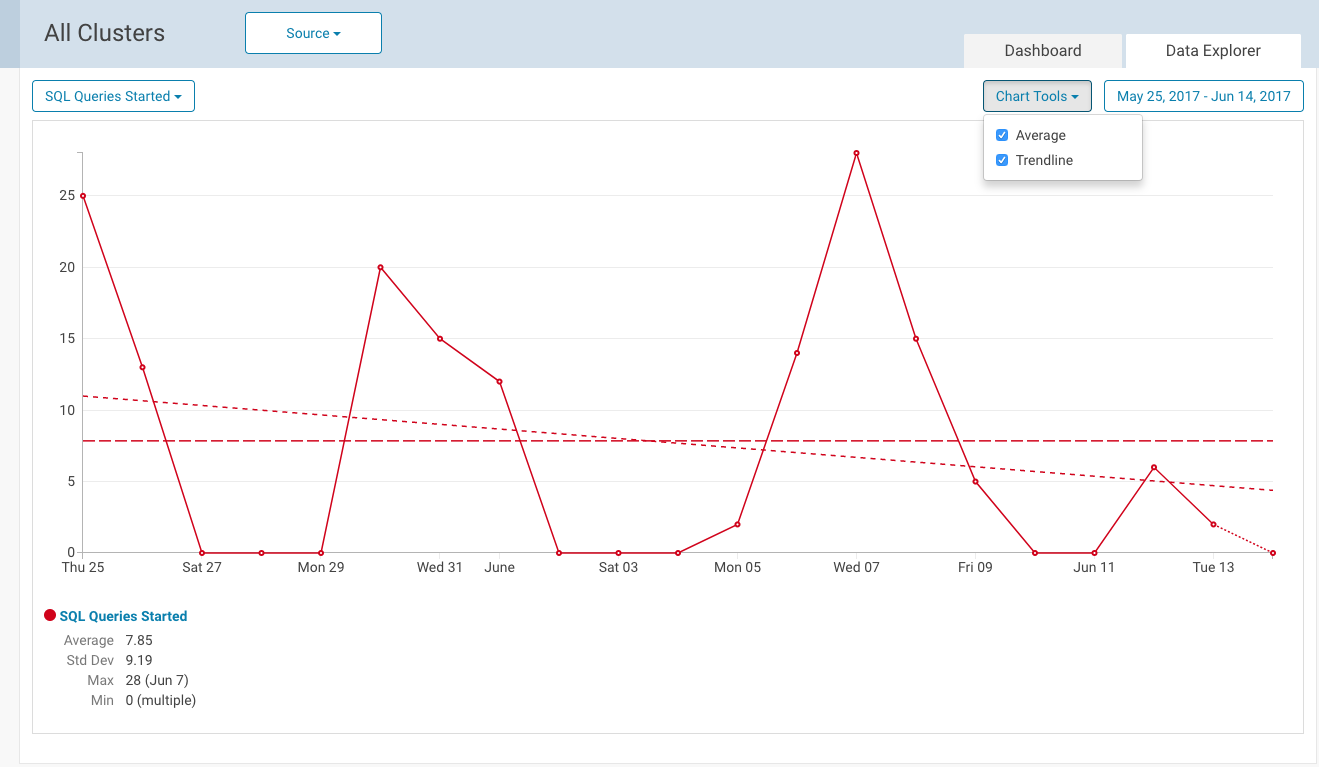
Administrators can look for trends, the administrator navigates to the Data Explorer tab, makes two selections to filter for the past several weeks on SQL Queries Started as source type and gleans some clues about a rogue SQL query.
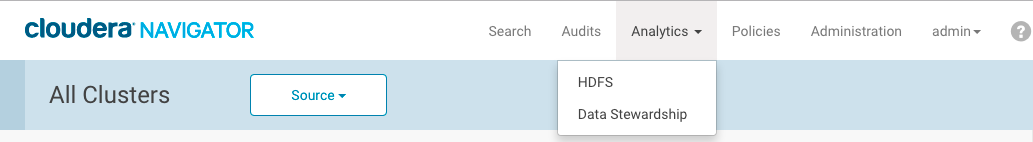
Access the dashboard by clicking Analytics and then choosing Data Stewardship on the navigation bar. Specify the source clusters by clicking Source and clicking a cluster name or All Clusters.
Dashboard
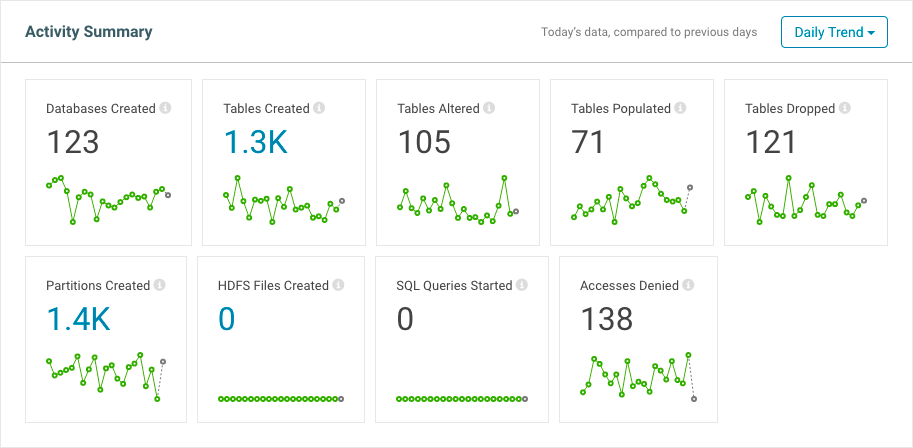
Activity Summary
- The name of the activity
- The number of occurrences for that activity for a time period that you select (daily, weekly, monthly, quarterly, all time)
- A line graph showing activity trends based on the time period that you select
A graphical representation of the time-lapse summary for each activity tile is located at the bottom of the tile. Hovering over a point displays the value for that entity on a particular date. For example, if you select Daily Trend, the number in the graph shows number of occurences for the day so far (since midnight), and hovering over a graph point shows the number of occurrences for that full day as well as the average for the 20-day period represented by the graph.
The Activity Summary area includes the following information:
| Databases Created | Number of new databases that were added to the cluster. |
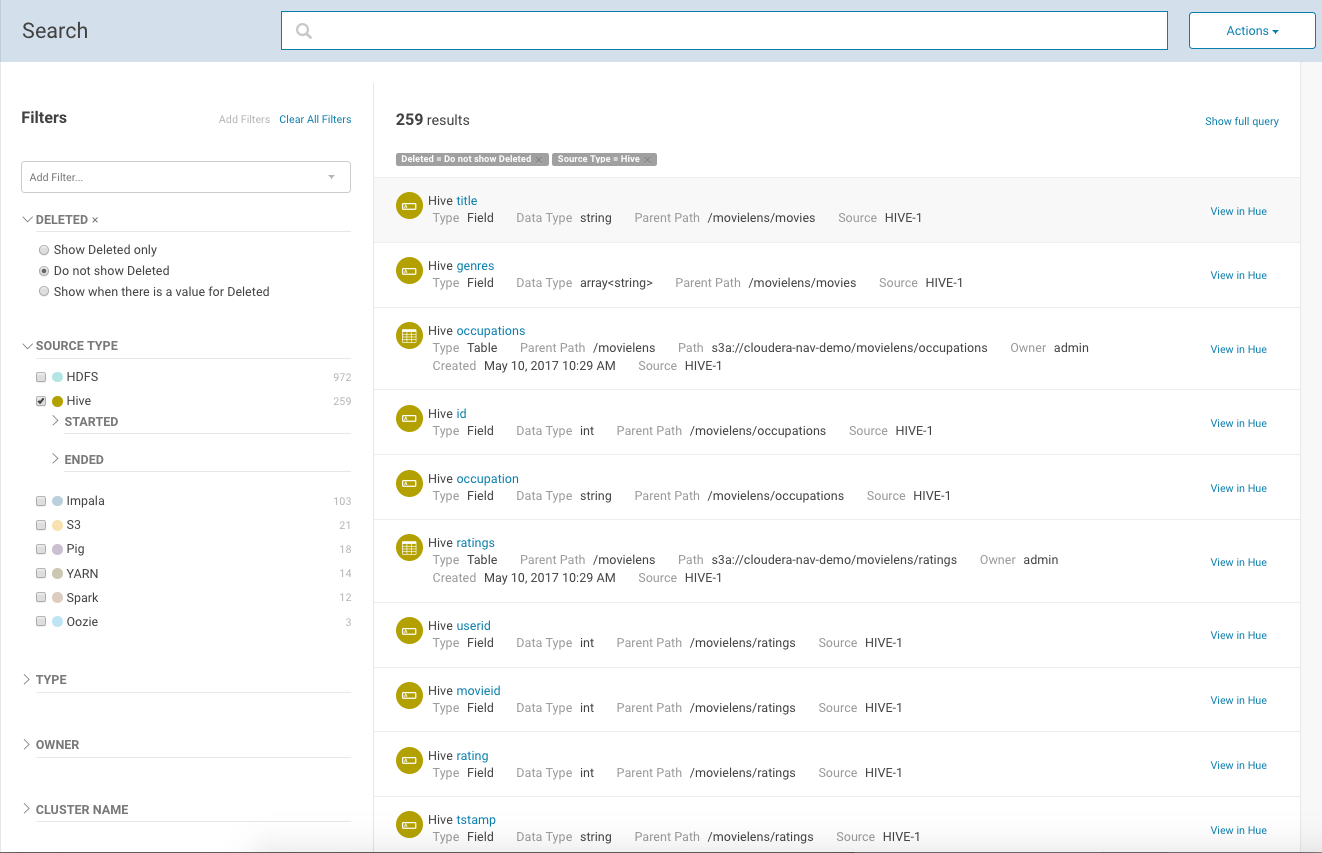
| Tables Created | Number of new tables that were added to the cluster. Click the value to link to the Search page that shows the search results of the query defined. You can apply filters to narrow the search results and perform any other search actions. |
| Tables Altered | Number of tables that were changed. |
| Tables Populated | Number of tables that were populated with data. |
| Tables Dropped | Number of tables that were deleted. |
| Partitions Created | Number of partitions added. You can apply filters to narrow the search results and perform any other search actions. |
| HDFS Files Created | Files that were created. Click the new files value to link the Search page that shows the results of the query defined. You can apply filters to narrow the search results and perform any other search actions. |
| SQL Queries Started | Number of SQL queries that were run. |
| Accesses Denied | Number of access attempts by users that were denied. |
Databases
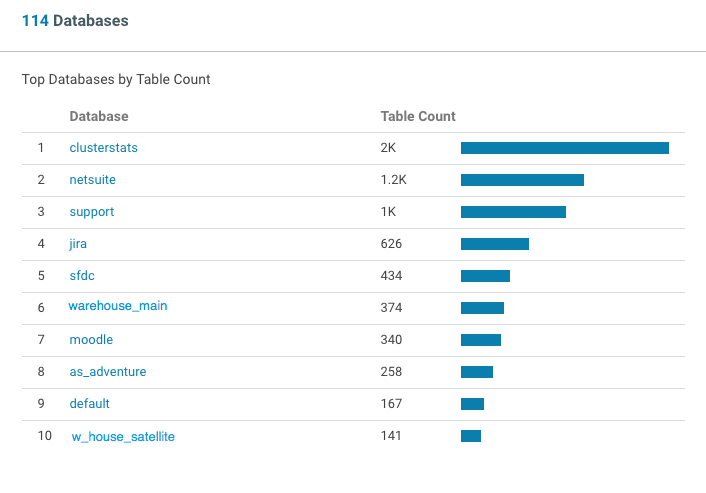
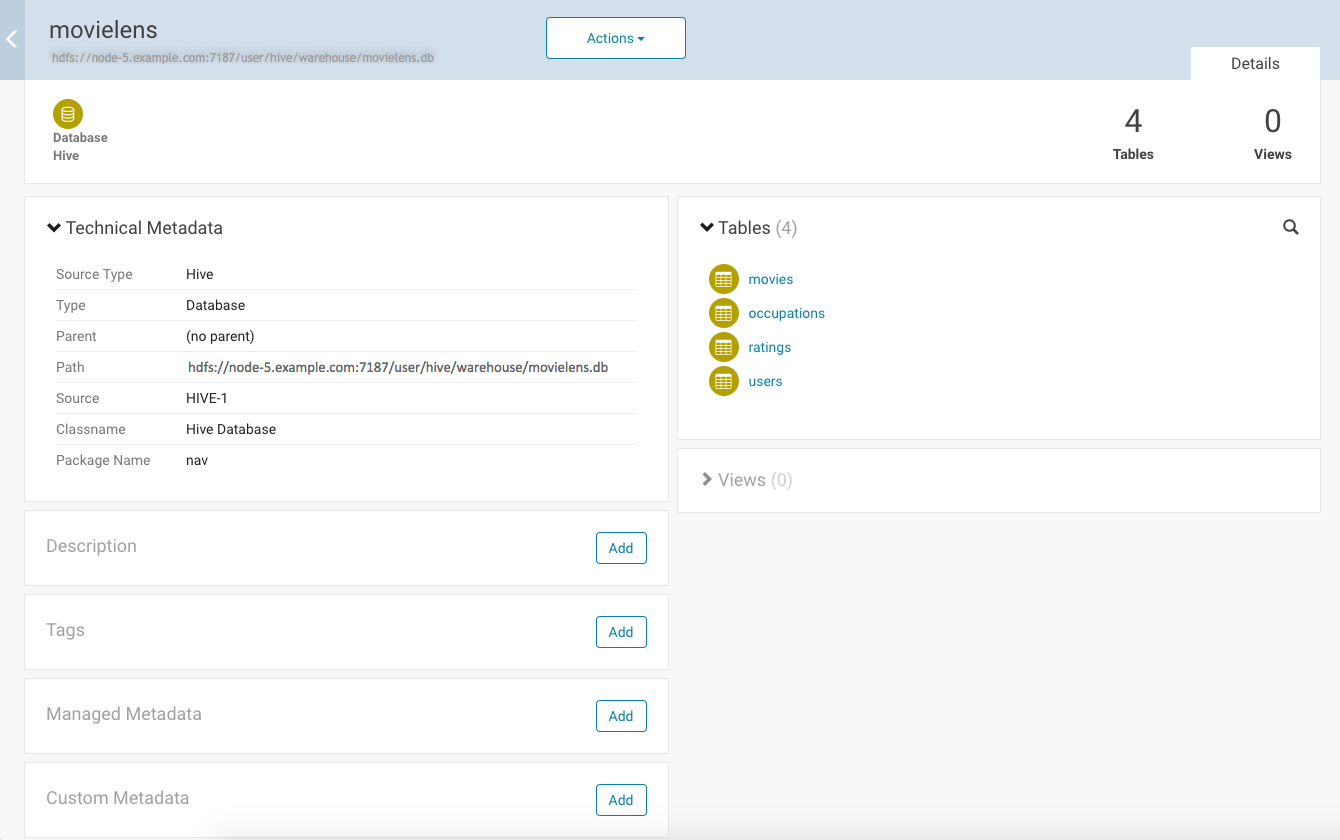
The Databases area of the Dashboard shows the total number of databases in the source clusters. The top 10 databases, by table count, are displayed in the bar graph.
Click the value next to the Database heading (in this case, 1.5K) to open a Search page showing results from the query "Deleted=Do not show deleted" "Type=Database". Apply or remove filters to refine or broaden the results.
Hover over the bar in the graph to see information about that database, and click the bar to open the Details page for that database. The following figure shows the Details page for the database nav_policy_db.
Hive Tables
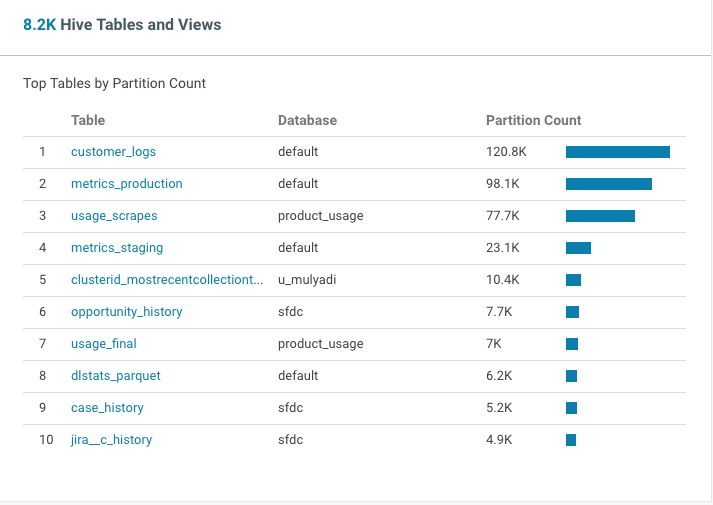
The Tables area of the dashboard shows the total number of Hive tables in the cluster. The top 10 tables, by partition count, are displayed in the bar graph.
Click the value next to the Hive Tables heading (in this case, 103.9K) to view matching tables in Search.
Click the bar to open the Details page for that table.
Files and Directories
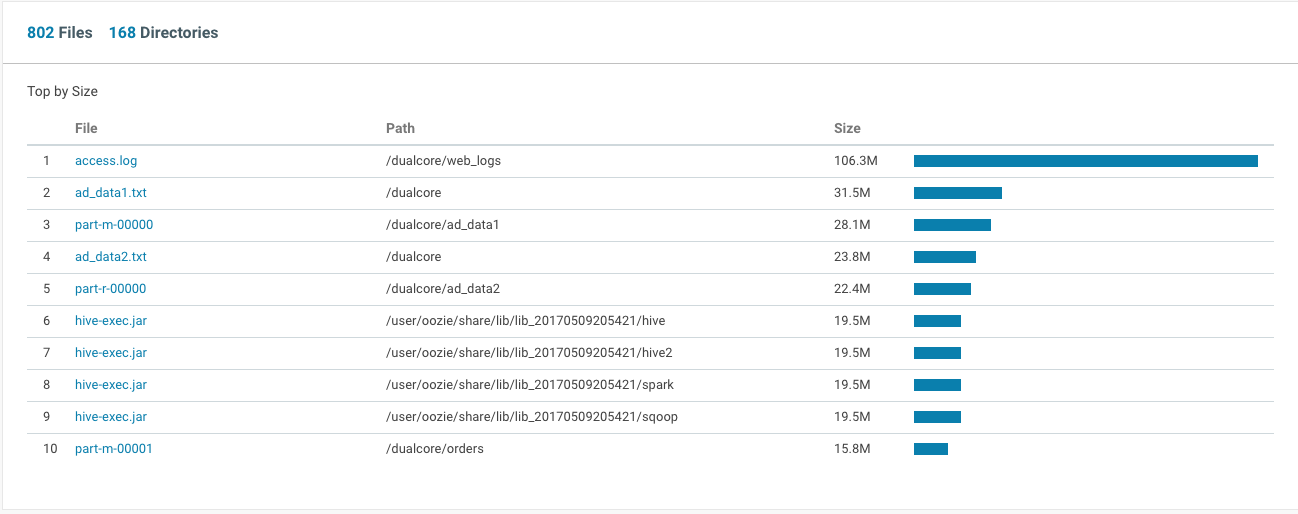
The Files and Directories area of the Dashboard shows the total number of files and directories in the cluster.
Clicking the value next to the Files or Directory heading (in this case, 64.6M or 16.2M, respectively) to show matching files or directories in Search.
The bar graph displays the top 20 files, based on size. Hover over the bar in the graph to see information about that file. Click the bar to open the Details page for that file.
Operations and Operation Executions
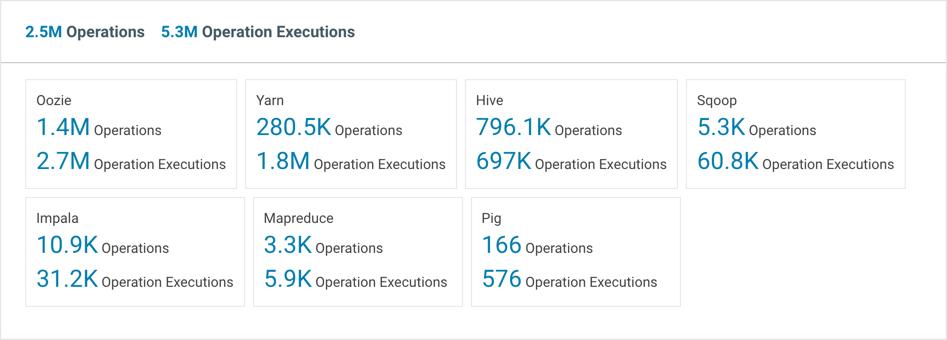
The Operations and Operation Executions area of the Dashboard shows the total number of operations and operation executions that occurred in the cluster for the specified period of time.
Click the value next to the Operations or Operations Executions for a service to view matching operations or operation executions in Search.
Data Explorer
| << Cloudera Navigator Console | ©2016 Cloudera, Inc. All rights reserved | Cloudera Navigator Auditing >> |
| Terms and Conditions Privacy Policy |